
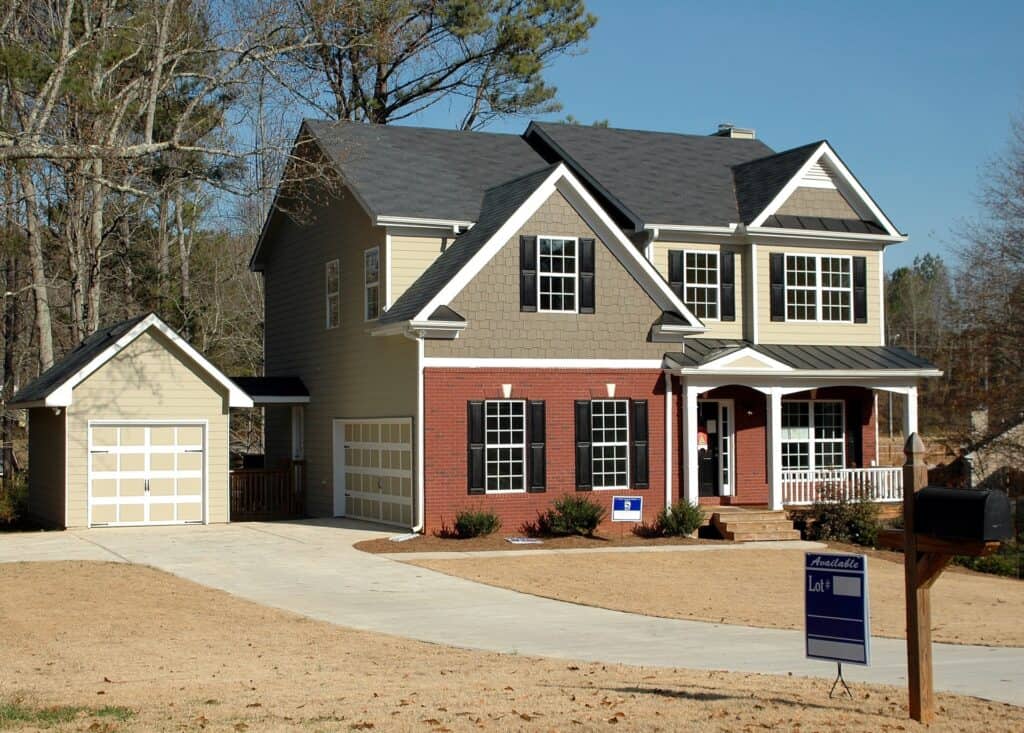
4 Ways to Find the Ontario Neighbourhoods Poised for Peak Appreciation
4 Ways to Find the Ontario Neighbourhoods Poised for Peak Appreciation
Looking to invest in real estate? If so, how do you know which suburb is the right one to invest in? As an investor, you’ll want to be in the know of neighbourhoods that have a high likelihood of appreciating.
We’ve broken down the four ways to know if an Ontario suburb is poised to beat the rest.
There are several neighbourhood statistics you can use to determine if a neighbourhood is up and coming:
1. Municipality demographics
Each city releases data such as crime and unemployment rates as well as the average household income. In particular, a declining crime rate is a good indication of an upcoming suburb. Typically unemployment rates and average household income can be found on a municipality website. Crime rates can also be found on a municipality or regional police website.
2. Ratings and rankings
It’s also a good idea to take a look at rankings from real estate and financial leaders such as ReMax and Macleans.
These websites not only look at statistical data, but they also consider factors like proximity to amenities and services, as well as walkability.
For example, ReMax releases a Canada liveability report each year that includes factors such as walkability, driveability, and access to green space. A suburb that is walkable and close to amenities and services like work, healthcare, and grocery stores is a good sign that it’s up and coming.
Maclean’s, also provides insight with their annual report on Canada’s Best Communities. In addition to an overall ranking, Maclean’s also provides rankings based on families, retirement, weather, and affordability. If a community is rising through the ranks on Maclean’s year after year, that’s definitely a community worth considering.
3. Construction projects and new buildings

Although it can be a pain for current residents, construction and major developments means a thriving community. Revitalization and upgrading projects such as replacing street lights as well as fixing potholes and sidewalk cracks are healthy signs of growth.
To see what construction projects are underway, municipalities typically have a building and construction page on their website where you can see what projects are going on.
In addition to neighbourhood projects, major developments like a building restoration, high rise condominiums, and new office or retail space is a sign a neighbourhood is on the rise.
One way to find out about new construction projects is through the release of municipal building permits. New buildings and businesses are typically an indication of economic activity and a means to attract more people into a neighbourhood.
4. Sales data
Real estate sales information can be used to measure a neighbourhood’s growth. Useful data points to look at include the average days listing spend on the market, average or median sales price, and total sales.
If there’s a decrease in the average days spent in the market, and an increase in the average sales price and total sales, that’s an indication of a growing market.
You’ll also want to look at the trends year after year in these data points. If the average days listed rate has trended downward over the years and the average or median sales price has been increasing over the years, that’s a sign of an upcoming market. Real estate sites like Zolo provide market insight into Canadian cities like Hamilton.
Knowing if a neighbourhood is in a buyer’s or seller’s market can gage whether or not a neighbourhood has a high likelihood of appreciation.
In a buyers market, there’s more supply and less demand meaning the buyer has the power to negotiate better deals. In a seller’s market, there’s more demand and less supply meaning the seller has the power to negotiate deals.
The sales-to-listing ratio in a seller’s market is generally at 60% or more, which translates to six or more sales for every ten new listings.
However, in a balanced market, the ratio is between 40% and 60%, and in a buyer’s market, you’re looking at fewer than 4 sales for every 10 new listings.
When researching upcoming neighbourhoods, you’ll want to know if it’s in a buyer’s market because you’ll buy real estate at a lower price and have a better opportunity for appreciation.
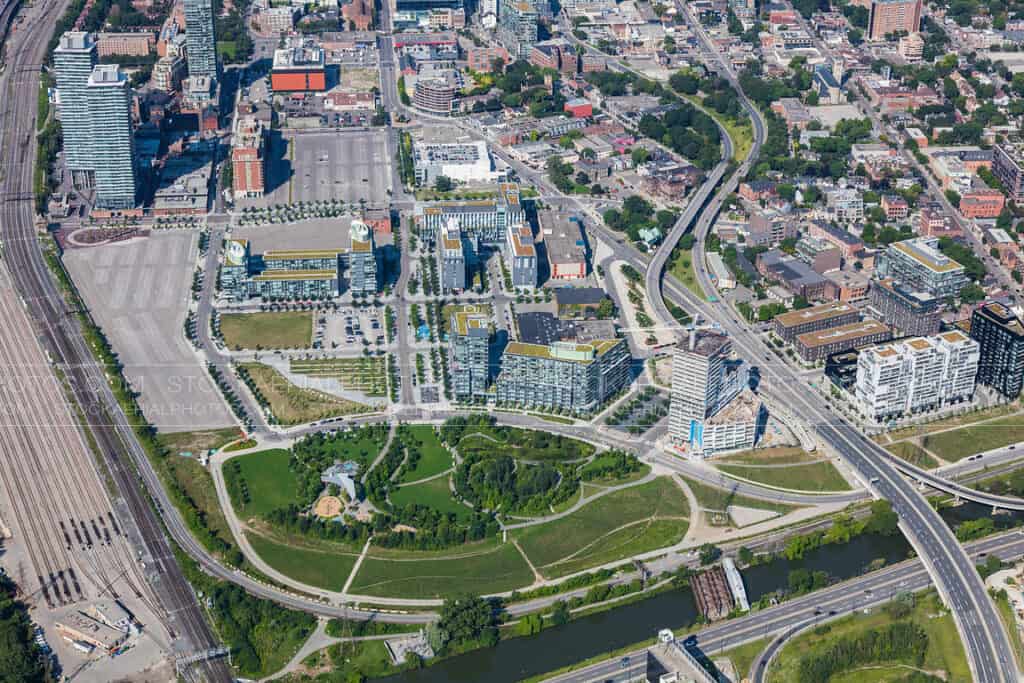
4 Up-and-coming neighbourhoods in Ontario
With the considerations mentioned above, here are four Ontario neighbourhoods we believe are on the rise:
Beasly, Hamilton, Ontario

Neighbourhood statistics
Before the pandemic, Hamilton boasted the lowest unemployment rate of 3.7% out of all of the cities we analyzed in 2019. This trendy downtown Hamilton neighbourhood ranks number one as the most liveable neighbourhood in Hamilton in ReMax’s 2019 liveability report. The neighbourhood has a lot of shops and restaurants and has a walkability score of 80.
Construction projects and new buildings
There are also currently 6 city revitalization projects underway in Beasly. There have also been 6 new high rise developments that have been recently completed.
Sales data
The real estate market in Beasly is a seller’s market. It’s hot with a 34% year-over-year increase in housing prices and has an average of 22 days that houses spent on the market.
Centretown, Ottawa, Ontario

Neighbourhood statistics
Before the pandemic, Ottawa boasted a low employment rate of 5.1%. Located right next to the University of Ottawa and only a 10 minute walk to Parliament Hill, it’s no surprise that Centretown is one of the top liveable neighbourhoods in Ottawa according to ReMax’s 2019 liveability report.
Construction projects and new buildings
Over the past year, new high rise condo buildings and restaurants have come up. In fact, the City of Ottawa currently has a city wide official plan to become a more compact and affordable city. Included in this plan are new high rise urban zoning provisions and various area traffic management measures in Centretown.
Sales data
The real estate market in Centretown is a buyer’s market. It’s booming with a 25.4% year-over-year increase from October 2019 to October 2020 and houses spend an average of 14 days on the market.
Kitchener Centre, Kitchener-Waterloo, Ontario

Neighbourhood statistics
Before the pandemic, Kitchener also had a low unemployment rate at 5.7%. With a school of pharmacy and growing number of tech offices popping up in the area, Kitchener Centre ranks #1 as the most liveable neighbourhood in Kitchener according to ReMax. The neighbourhood has a lot of revamped buildings and has a walkability score of 89.
Construction projects and new buildings
The downtown core has seen a revamp in old downtown buildings which are turning into retail spaces as well as parking lots being turned into condos. In addition to the number of condo buildings going up, there are currently 6 city construction projects.
Sales data
The real estate market in Centretown is a buyer’s market. Kitchener itself has seen a 49.3% year over year increase from October 2019 to October 2020 in housing prices and houses spend an average of 12 days on the market.
Corktown, Toronto, Ontario
Neighbourhood statistics
Although Toronto has a higher unemployment rate of 6.3% , it doesn’t mean that Corktown isn’t an up and coming neighbourhood. This suburb has been ranked one of ReMax’s top 10 liveable neighbourhoods in Toronto.
Construction projects and new buildings
The surge in development of this neighbourhood can be attributed to the Pan Am Games, where Corktown Common was used as the Athlete’s Village. Since then, the neighbourhood has been growing. A number of new high rises have been and are still being built despite the pandemic. There have been talks about a Corktown Station being added when the GO Train Ontario line is built.
Sales data
The Corktown is a seller’s market. It also has a hot real estate market with a house being listed on the market for an average of 9 days and a 15.6% year over year increase from March 2019 to 2020 in condo prices.
What does this mean for you?
Whether you are interested in personal home buying or investment real estate, these tools will allow you to effectively evaluate the value and potential of any given neighbourhood.
With these considerations, you’ll be able to discover up-and-coming neighbourhoods and achieve a high appreciation on your investment.
However, if you are looking for a simpler and even more reliable option, investing through BuyProperly could be a great option for you.
BuyProperly works by allowing investors — both novice and experienced — to enter the real estate market through fractional investment. For as low as $500, you can own a piece of an investment property, without the burdens of putting together a hefty down-payment, finding and managing tenants, or dealing with property maintenance issues.
BuyProperly assures investors that each property they acquire has been evaluated from top to bottom, starting with the methods highlighted in this article. BuyProperly’s goal is to make it as easy and risk-free as possible for you to invest.
If you’re interested in real estate investing, but the property evaluation process is too much for you to deal with, rest assured that by investing with BuyProperly, all the research and evaluative work has already been done for you.